You know that you have made it when your name becomes an adjective. In the course of our research on Jane Addams, we regularly come across people in all walks of life who are described as “the Jane Addams of India,” or “the Jane Addams of Northern Michigan,” or even “the Jane Addams of Social Work.” That last one seems a bit odd — as Jane Addams was clearly the Jane Addams of Social Work!
Because Jane Addams was engaged in so many reforms, her namesakes vary as well. Some are social workers and settlement women, such as Lillian D. Wald (New York), Constance Currie (Minnesota) or Muriel Lester (London). Others were peace activists, like Halide Edib Adivar (Turkey), Alice Salomon (Germany) or María Elena Landázuri Gil (Mexico).
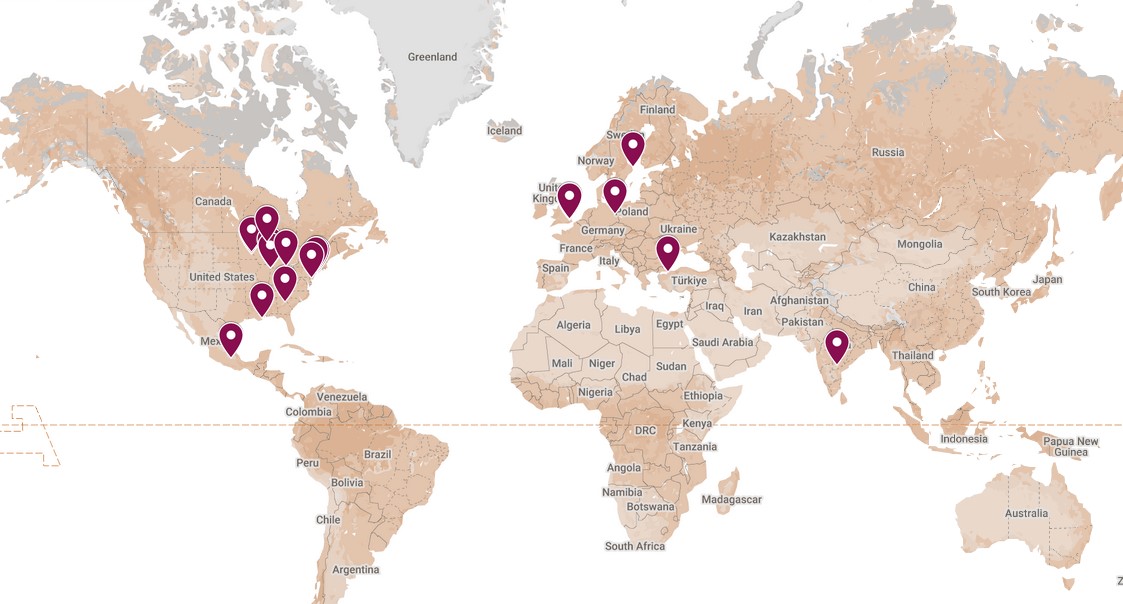
I’ve built an interactive map of those we have found so far with short biographies that you can explore (see in full screen) .
Who is the Jane Addams of Today?
Seeing the impact that Addams had on the lives of her contemporaries begs the question, Who is the Jane Addams of today? What problems do we face today that need someone of her character and care? Settlement houses faded away for the most part in the mid-20th century, but neighborhood organizing is still a vital movement. Immigrants still need help navigating American society. Even child labor, the reform Addams achieved in her lifetime, does not seem so settled. War still ravages the world, and its great expense hampers our ability to fund social services, education and health care.
Is she (or he) out there? — working quietly to better their neighborhood, protesting for peace and social justice, or helping improve the lives of individuals through sympathy and social work? Time will tell!
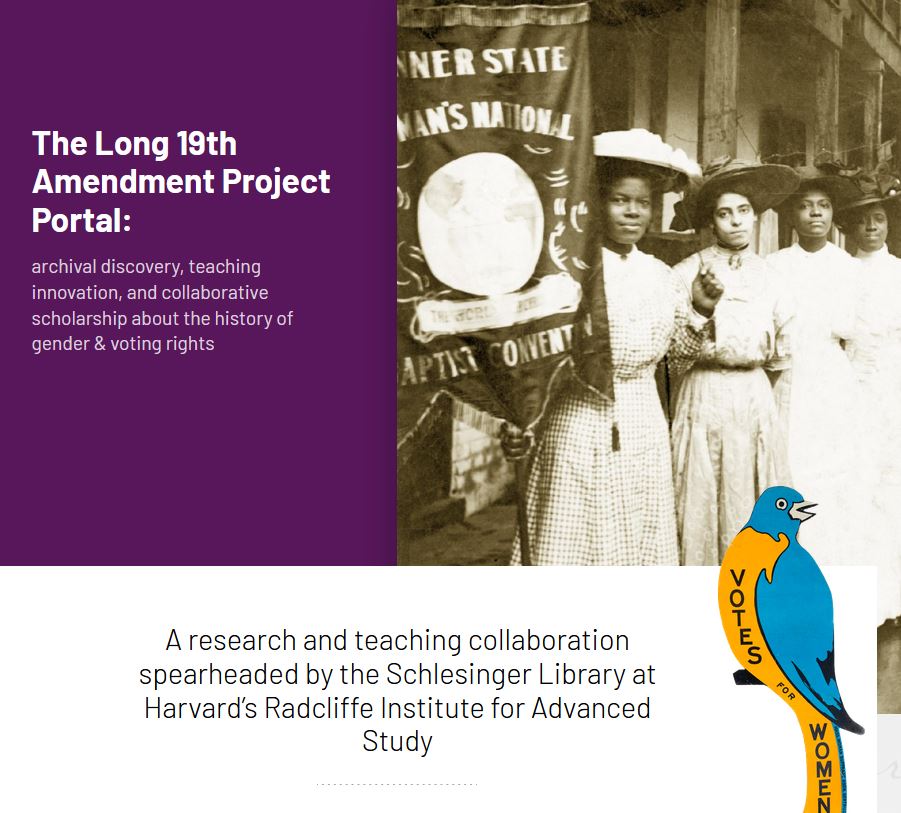
I am very pleased to announce that the Jane Addams Digital Edition has shared content from our site with the Schlesinger Library’s Long 19th Amendment Project, an amazing digital portal that revolves around archival discovery, teaching innovation and collaborative scholarship on the history of gender and women’s rights.
This project, supported by the Schlesinger Library and the Andrew W. Mellon Foundation, seeks to build collaboration by including digitized materials from well-known archives like the Papers of Susan B. Anthony and the Papers of Alice Paul at Schlesinger Library, but also includes materials from more than 40 contributing repositories.
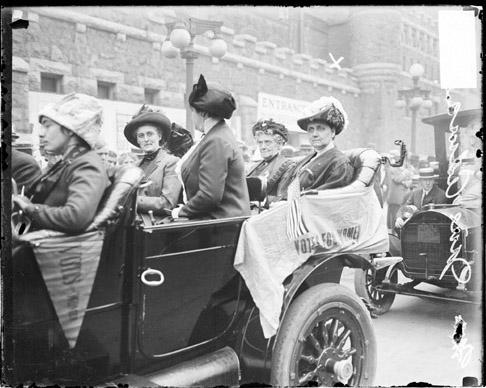
When we were approached by the Long 19th Amendment team, we were excited to participate for two reasons. Jane Addams isn’t known primarily for her work for woman suffrage. She is often mentioned in lists, or gets a small part in the larger history, but in her day, Addams was a leading suffragist. She was a vice president of the National Woman Suffrage Association and used her considerable fame to promote the movement. She gave frequent speeches on woman suffrage, especially on its impact for working women, spoke on college campuses, and testified before Congress in 1912 to make her argument.
The other reason that we were eager to participate, is that the Long 19th Amendment Portal offered the opportunity to fulfill one of our long-term project aims regarding data and data sharing. We want to be able to export our Dublin Core-based data from our Omeka content management system so that it can be repurposed and shared with other scholars. This project demonstrated that with just a little effort on our part, we could share more than 500 documents.
Looking at the Jane Addams Digital Edition in terms of woman suffrage, we had several options.
To share documents that have been tagged with Woman Suffrage
To share biographies of people tagged with Woman Suffrage
Working with the Portal team, we decided to share documents written between 1901-1920 in the first contribution.As we proofread more texts, we will update the data shared to include additional years. Our biographical collection will be included as a linked collection that researchers can locate and consult directly.
This is just the first in what we hope will be other collaborations with scholars working on related collections. If you are interested in accessing data from the digital edition, please do not hesitate to get in touch!
I recently took a course on Gephi, an open-source network visualization tool offered by the Programming 4 Humanists group at Texas A&M University. This three-session Zoom-based course, taught by Katayoun Torabi was a great entry to a digital humanities topic that I have long been interested in.
One of our long-range goals at the Jane Addams Papers Project is to make the underlying data in the digital edition accessible so that digital humanists can use it for research. Having a chance to play around with network visualizations helped me to think through how we might use this tool to understand Jane Addams’s life and her causes in new and interesting ways. It also helped me better understand what we need to do to make data from our edition available.
A few ideas popped out immediately:
a visualization of Addams’s correspondence, modeled on the ideas used to create the Mapping Republic of Letters project at Stanford.
a visualization of how people in the Addams’ digital edition were connected via organizations, looking at for example, the interactions between women involved in the suffrage movement and the peace movement.
In this post we will look at correspondence networks.
Thinking About Data
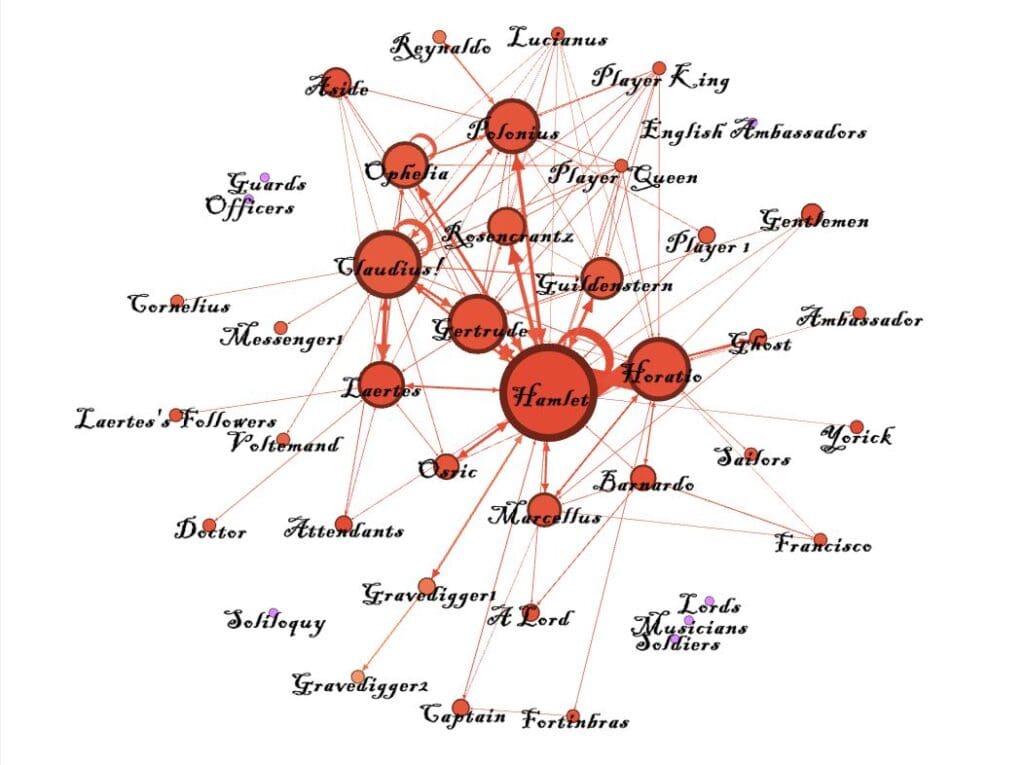
The examples that Katayoun used in our class were all drawn from literature. We mostly worked with data from Shakespeare’s Hamlet, looking at instances of speech between characters to create visualizations of how the characters related to one another.
Here is my visualization of Hamlet using Katayoun’s data set. Central characters have larger circles and appear in the center, while less important characters are further out, smaller and have fewer appearances.
What struck me almost immediately was that the difference between this kind of analysis and what I hoped to do, was that with a literary work (or any single historical record), this analysis can provide an accurate representation of that text. As I thought about how we could this tool to understand the Jane Addams Papers, the problem of incomplete data reared its ugly head.
We have to understand that any visualization of the Jane Addams papers cannot fully be a visualization of Jane Addams’ life. Addams’s papers are incomplete. We are missing many of Addams’ most intimate letters between family members and her long-time companion, Mary Rozet Smith. At best, we might be able to visualize more of her professional life than her personal one. But we are also missing many, many letters sent to colleagues and acquaintances that never made it into archives and private collections. Many of the papers of Addams’s European counterparts did not survive World War II. So what we are left with is an impression, a partial glimpse into her world, but an imperfect one.
What can counts of letters tell us about Addams’ life? When I first took on editing the Addams Papers, I tried to estimate (by counting entries in the microfilm edition index) how many documents we had in the base collection so that we could estimate how long the project would take. Even as basic a visualization as the one below can help you see the broadening of Addams’s life as she moved from a local activist to one who operated on a global scale. It can give a rough visualization of when things happened in her life.
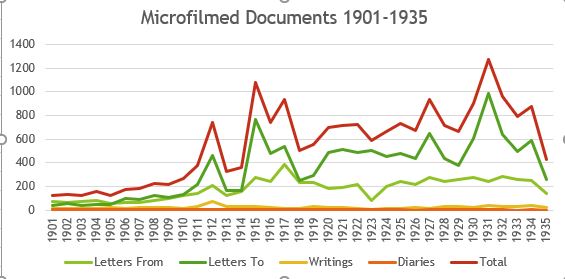
Counts from the microfilm index.
This red line (total documents) gives us a good sense of scale, and also the years where we could expect the heaviest number of documents. In the first ten years (1901-1910) we had low document counts, which rose dramatically in 1912 (Addams’s participation in the 1912 presidential election), 1915 (Addams’s establishment of a peace movement in the U.S. and international peace congresses). Her activity through the 1920s and early 1930s remains high, with peaks in 1927 and 1931 (Addams’s Nobel Prize).
Looking at the lighter green line (letters written by Addams), we see a fairly consistent output until the end of her life. The only outlier is 1923, a year in which Addams was on a tour of Asia and then suffered from serious illness. It is possible she wrote fewer letters, or fewer of them survived. Most of the dramatic peaks come from increases in incoming letters.
Anneliese Dehner, our web developer prepared a spreadsheet that represented the Item Relations for people in our digital edition. I was able to work with that in a rudimentary way to explore Gephi.
Nodes and edges
In network visualization there are two tables of information, nodes, which are unique objects, and edges, which link nodes by some kind of action. The hard work of network visualization is gathering all this data so that it can be displayed by Gephi or any other tools.
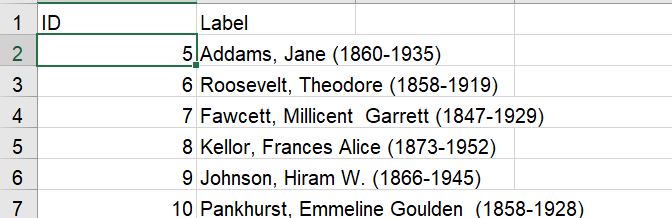
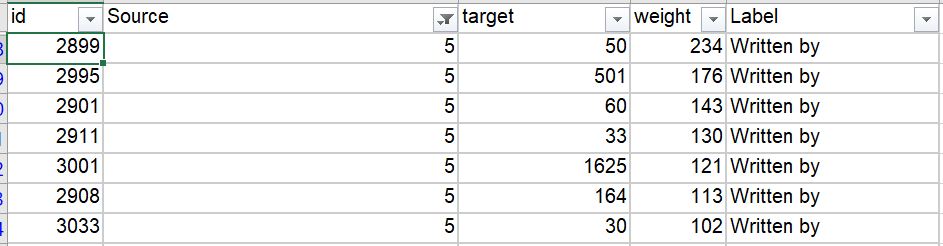
For a correspondence network, the NODES are the people in the database. They get an ID (in our case the Omeka ID number on our database) and a LABEL (the name of the person).
Here is a snippet from the Nodes table. Each name in the database is assigned a unique identifier.
The EDGES represent the letter. They contain an unique ID, a SOURCE (the ID number of the author of the letter) a TARGET (the ID number of the recipient of the letter) and a WEIGHT (the number of times that that same combination appears). They can also have a LABEL (the relationship — in this case “Written by”). The most common recipient, with 234 letters, is Sarah Alice Addams Haldeman (#50), the sister of Jane Addams. In second place is Emily Greene Balch (#501), a co-worker in the peace movement, donor Anita Blaine McCormick (#60) in third place, and social worker and settlement founder Lillian Wald (#33) in fourth place.
This table of edges show author Jane Addams’ (#5) most frequent recipients.
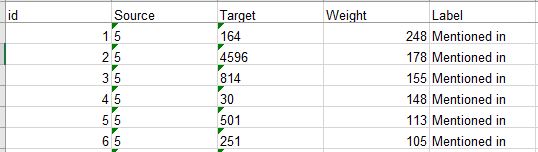
Another table of EDGES describes the people who were Mentioned in a document, not just the authors or recipients. This might get at a more representative understanding of Addams’s network because one could surmise that important people might be mentioned in letters even if the correspondence between those two people might be lost. And here we do see different results. On this table Mary Rozet Smith (#164), Addams’s companion comes out at the top, with Woodrow Wilson (#4596) coming in second, donor Louise DeKoven Bowen (#814) in third place, and Addams’s niece, Marcet Haldeman-Julius (#30) in fourth place.
This table shows the most commonly mentioned people in letters written by Jane Addams (#5).
Basic Visualization
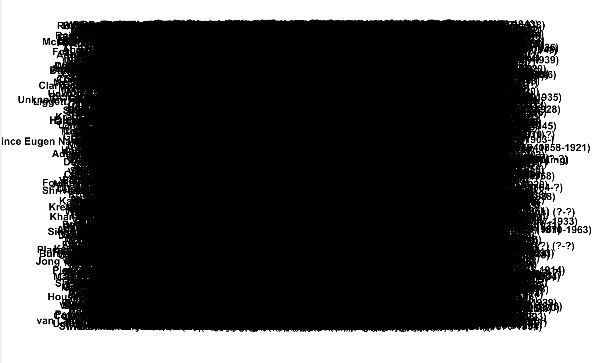
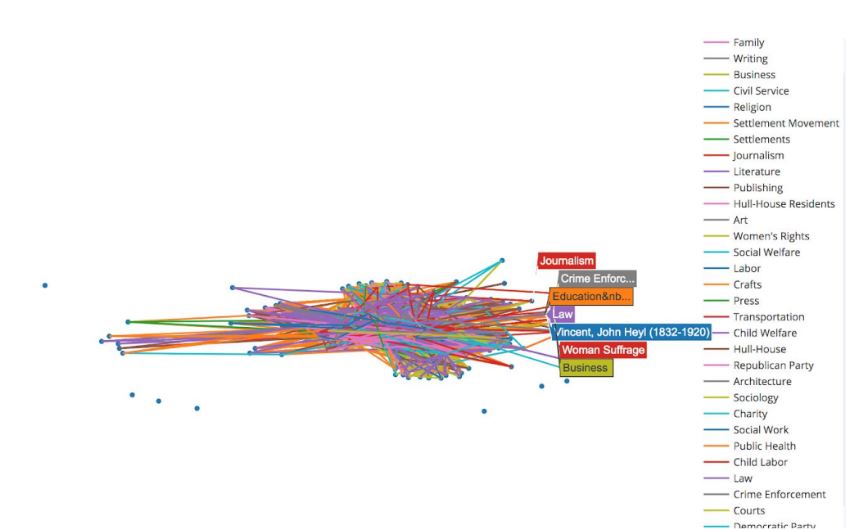
My first visualization of the mentions data was, to be frank, underwhelming, unless you like big black boxes of goop!
There are simply too many points in this data!
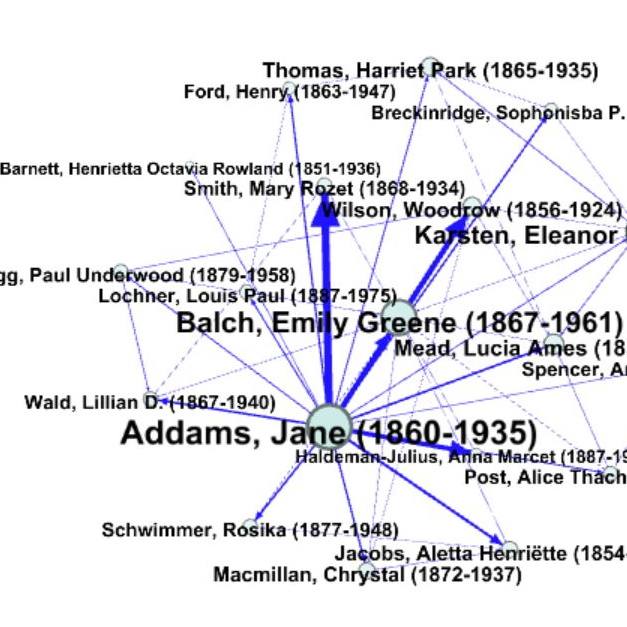
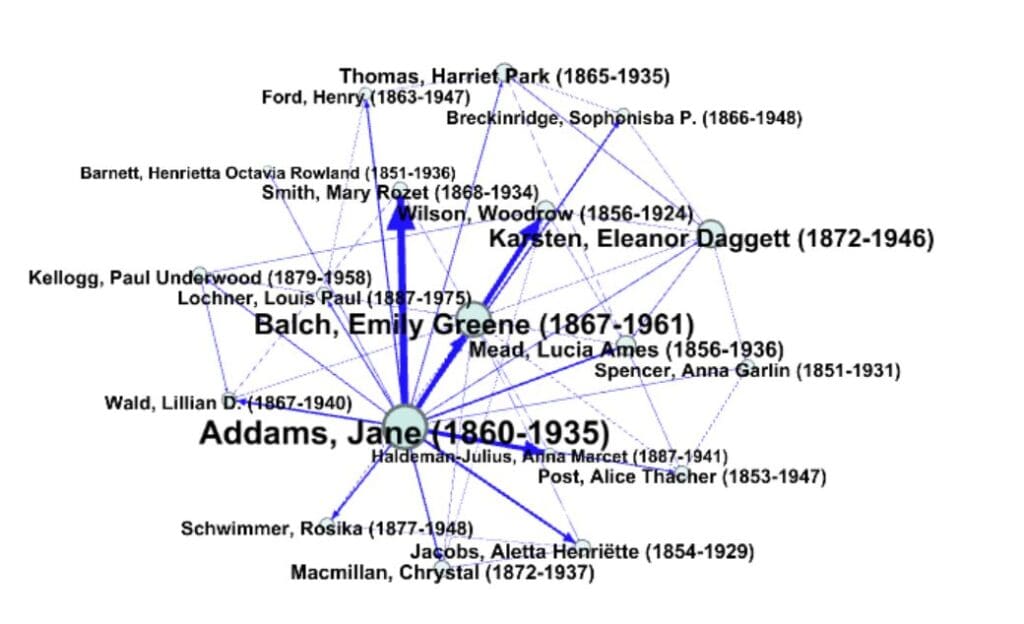
We have over 10,000 names in the NODES table. To get to a visualization that is more legible, I excluded edges with less than 10 mentions in the correspondence. Now that is readable! The weight of the line indicates the number of mentions.
These are the people mentioned the most in the digital edition, thus far.
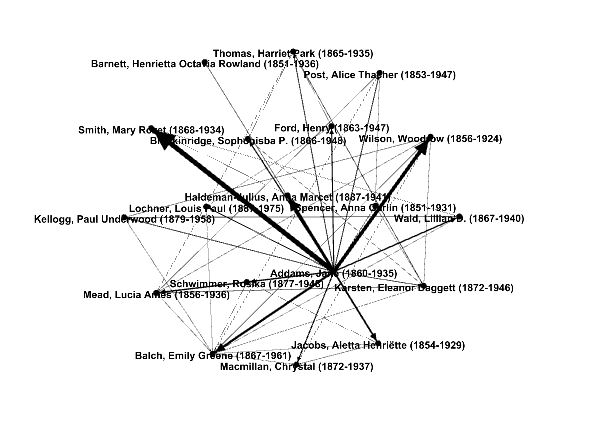
I played with the appearances of our networks to make them easier to understand. Making the labels and the circle sizes proportional to the number of mentions allows you do see things more clearly.
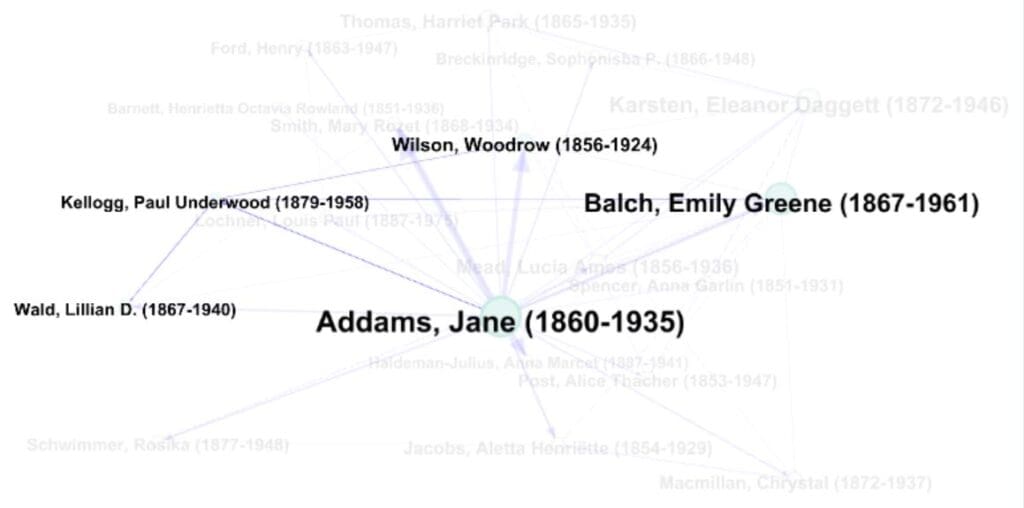
The visualization is interactive. If I click on Paul Kellogg’s circle, only those names associated with him are highlighted– in this case a small subset of the network.
Paul Kellogg of the Survey’s network.
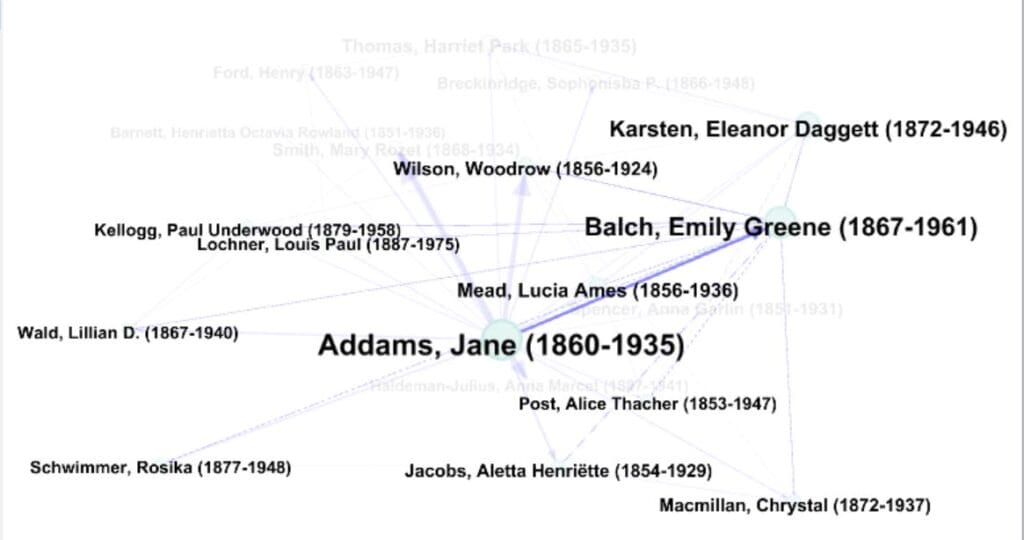
While Emily Greene Balch, a peace activist, is far more interconnected.
Emily Balch worked with Addams in the Woman’s Peace Party and the Women’s International League for Peace and Freedom.
The idea here is to explore the various networks that Addams built in her work for peace, social justice, social work, and other causes.
Next steps
Generating the data to build the NODES and EDGES tables requires some work, and filtering the data to get a meaningful result will be critical to creating data sets that the public can use. Our goal is to make this kind of data accessible to students and digital humanists to explore data visualization and Jane Addams.
We are still adding documents to the digital edition, so the first step may be building a dataset of correspondence for each year that we have completed.
In my next post, I’ll look at building a network using our data on people and organizational membership.
Last spring I had the pleasure of working with two undergraduate students, Taylor Lundeen and Catie Olson, enrolled in the University of Michigan’s School of Information. They worked on a capstone project on data visualization, using our Jane Addams digital edition databases. Anneliese Dehner, our web developer, helped out with the some technical aspects of the collaboration.
One of the many great things about digital publication is that the information we create can be reused and repurposed in ways that we might not have thought of. Making our data available to researchers to explore has been one of our goals from the start of our work on Jane Addams, and with this investigation we have learned what we can do fairly easily, and what is more complex.
Accessing the Data
Our first step was to get a copy of our data exported out so that Taylor and Catie could work on it. What they found worked the best was an Omeka plugin (Omeka Rest API) that allowed them to export data in a format that worked well with data manipulation software.
Our ultimate goal is to have a utility on the digital edition that will enable users to download all or parts of the data for investigation.
One problem that reared its head immediately is that we have a very large dataset, and it is growing larger every day. This made it difficult, using the tools they had available to work with the whole set.
Natural Language Processing
One of the approaches, which Catie worked on, was seeing what we could learn from analyzing the “Text” field in our database, where transcriptions are stored. This kind of analysis can track the frequency of words, or compare word usage over time. Eventually it could be used for topic modeling, where a digital tool tries to make sense of words that appear together. These groupings can uncover connections that we sometimes don’t expect.
An important step in working with our texts was data cleaning, the process by which HTML and special characters were cleaned out and text was split word by word. Then Catie built bar charts that displayed the most common words. She built a separate chart for each year to allow us to compare years to see what Addams was thinking and writing about.
The most obvious finding to me, was that we needed to think about stop words — words that are excluded in the results because they are too common or have no analytical meaning. Articles, like “a” and “the” are common stop words– we also had to consider “page” which we use to signify the next page in our transcriptions, and, gulp, even “Hull House” because we transcribed the letterhead that Jane Addams used. Other words like “Mrs,” “Mr.” and “Miss” and salutations like “Dear” are candidates for being pulled from the analysis.
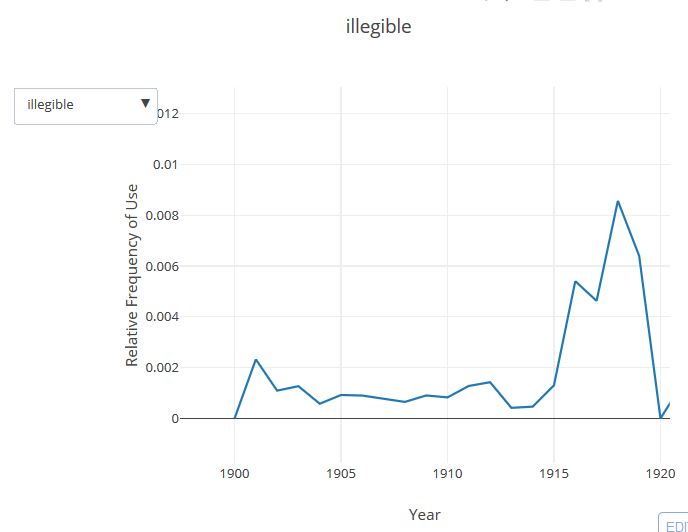
We also got to see the frequency of that nemesis of editors – “illegible.” This comes up far more frequently than I would like, but I was gratified to see that in the years where we have proofread the texts, the frequency is much lower.
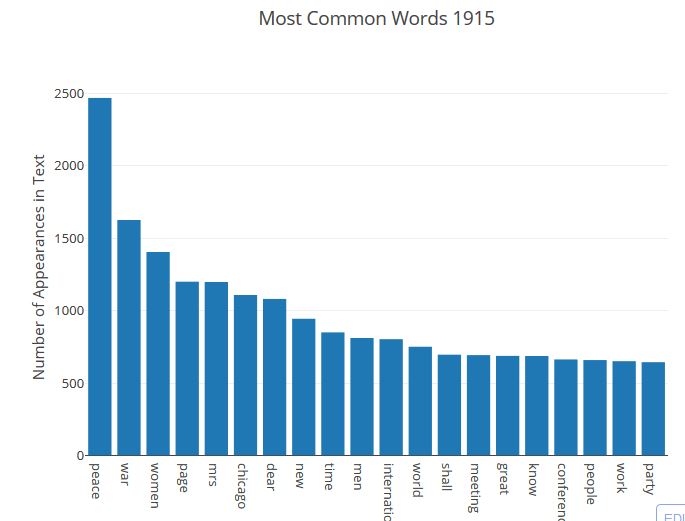
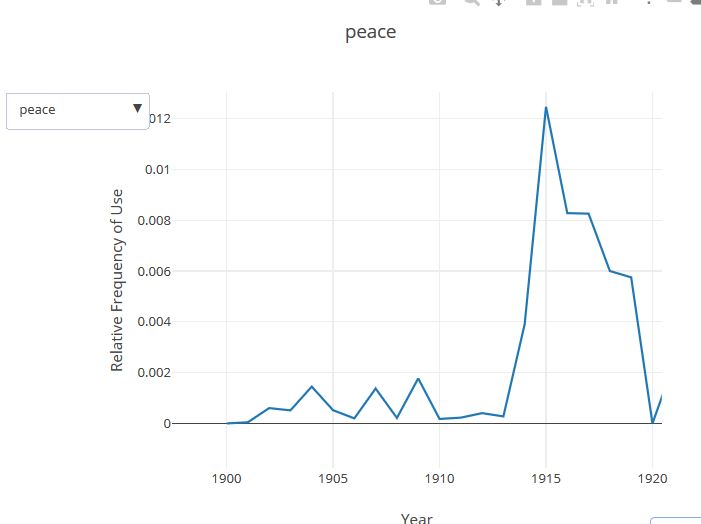
It will surprise no one that “peace” and “war” shot to the top in 1915.
Frequency of words in 1915.
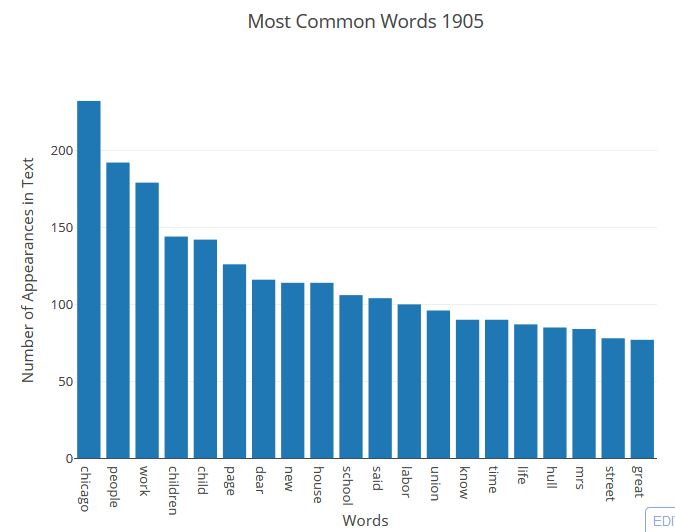
In 1905, the most frequent words deal more with the plight of children and represent Addams’ work on child labor and welfare in Chicago.
Frequency of words in 1905.
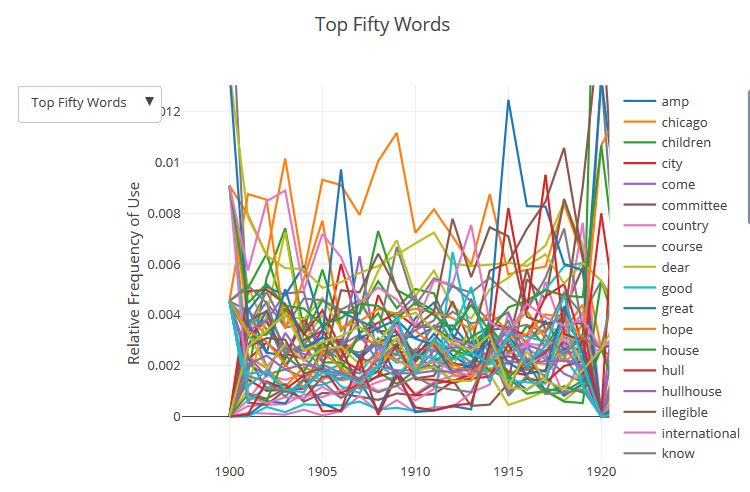
Catie also worked on another way to show the content of Addams’ writings, plotting the frequency of a word over time. Similar to the Google n-gram viewer that can compare the frequency of words in Google Books over time, this gives you a sense of the chronology. We did not have the capacity at this point to allow users to type the words they want, but were able to produce n-grams for some of the most popular words.
Seen together, it is a little frightening, but on the live version on the site, you can select a single word to analyze.
The Top 50 Words, all in one place!Tracking “peace” from 1901-1917.
The n-gram for “Illegible” shows the power of proofreading! When the data was downloaded for use, we had just finished proofreading 1915!
An n-gram of words we could not read.
Social Network Analysis
Another approach was to see what we could learn from social network analysis. Using Omeka’s Item Relations plugin, we have been tracking relationships — mostly between documents and the people, organizations, and events that are mentioned in them. We also are building connections between people and organizations, tracking which people were members of which organizations, for example, or who participated in a specific event. We wondered whether the relationships between people and organizations might yield some interesting insights, or whether we could find other connections between people and the metadata gathered about them. Taylor was responsible for this project.
Our large dataset proved to be problematic for developing a meaningful social network based on shared connections. We think there is promise for this in future by controlling which people are included in the network, but the sheer number of people and the amount of common tags produced a daunting graph.
This plot includes only 270 Addams connections associated with Chicago. The full data on 8,000 names was too complex to load.
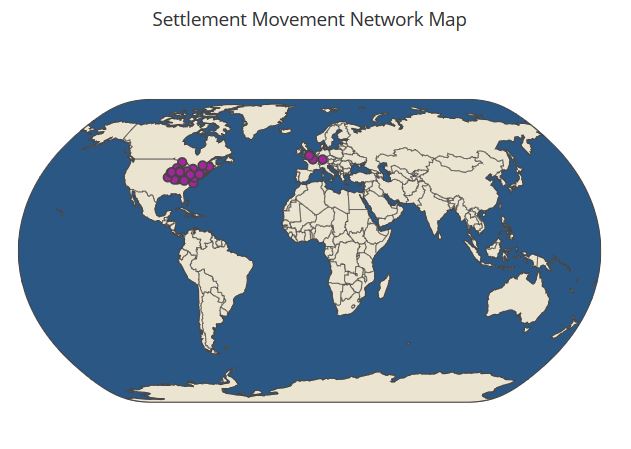
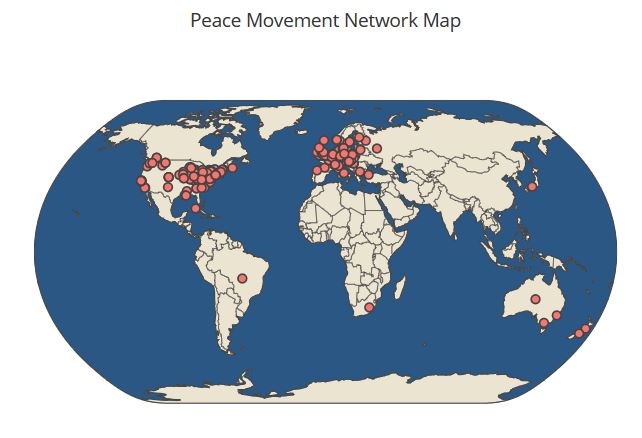
Instead, Taylor created a geographical visualization of Addams’s social networks related to several topics. We used our tags for movements like “Woman Suffrage,” “Child Labor,” and “Peace” and plotted their geographic locations. Compare Addams’ Settlement Movement network and her Peace network below to see the expansion of her work internationally.
On the live version of these maps, you can zoom in and out and mouse over each dot to reveal the name of the activist.
Going Forward
It was amazing to see what two talented students could do in such a short period of time! The experience has helped us think more about how we want to make our data accessible, and has uncovered challenges that we need to think about. Our database is large and complex and developing means to limit the queries is going to be important.
We are looking forward to working with other UMSI students and any digital humanists interested in advancing this work.
 When we were approached by the Long 19th Amendment team, we were excited to participate for two reasons. Jane Addams isn’t known primarily for her work for woman suffrage. She is often mentioned in lists, or gets a small part in the larger history, but in her day, Addams was a leading suffragist. She was a vice president of the National Woman Suffrage Association and used her considerable fame to promote the movement. She gave frequent speeches on woman suffrage, especially on its